 |
 |
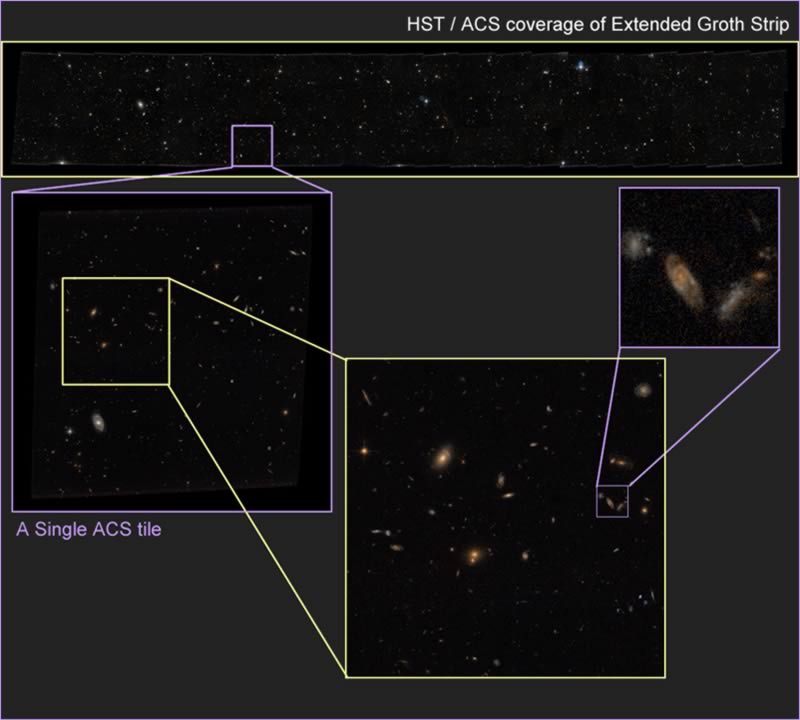
A schematic map of the Extended Groth Strip showing the scale of a single HST / ACS tile This schematic map shows the extent of the HST observations of the Extended Groth Strip. The entire HST region is shown at the top of the image. This corresponds to the dark grey strip in the center of the EGS Coverage Map, and covers an area on the sky approximately the same size as the full moon. The field is made up of 63 individual "tiles" which are the size of the field of view of the Advanced Camera for Surveys (ACS). For each tile, HST stared at the same patch of sky for over an hour to produce these color images. To explore an interactive image map of the HST / ACS Extended Groth Strip mosaic, click here (external link). Download medium resolution EGS mosaic image (JPEG 2.4 MB, 1440 x 8400 pixels) Download high resolution EGS mosaic image (JPEG 6.7 MB, 2880 x 16800 pixels) |