 |
|
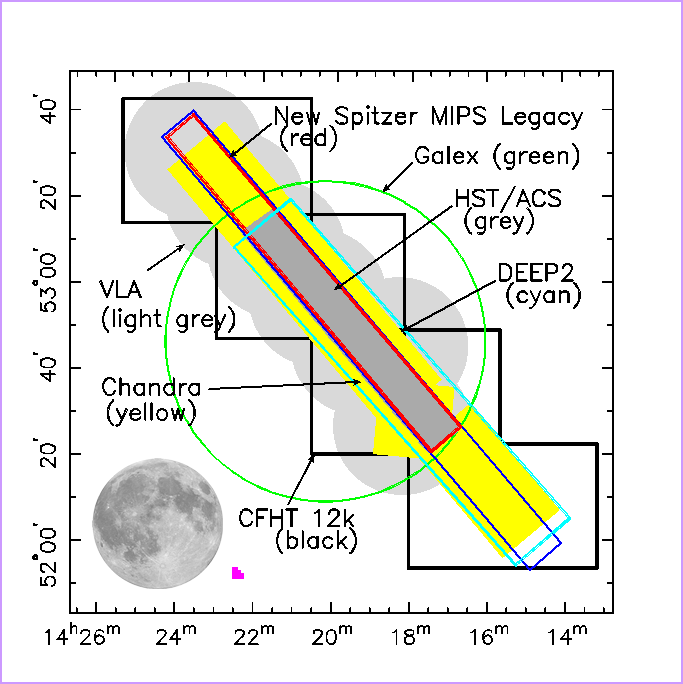 |
Map of the Extended Groth Strip showing the coverage at various wavelengths This is a map of the Extended Groth Stirp (EGS) region of the sky, showing the sky coverage for several of the AEGIS data sets. For reference the full moon is shown to scale. Shown next to the moon is the size of the original Hubble Deep Field (pink shape). The Hubble Space Telescope (HST) images taken as part of AEGIS using the Advanced Camera for Surveys (ACS) are shown in grey in the center of the EGS. The HST / ACS images for AEGIS cover more than 140 times the area of the original Hubble Deep Field, but are able to detect galaxies just as faint with shorter exposure times. This is because the ACS instrument is much more sensitive than the Wide Field Planetary Camera 2 that was used for the original Hubble Deep Field. In addition to the large region of deep HST imaging, AEGIS includes observations at many other wavelengths, all of which provide complementary information about the galaxies and clusters of galaxies that we see in the EGS. GALEX is an orbiting space telescope that detects ultraviolet light, which reveals bursts of recent star formation in distant galaxies. The light from collections of young, newly-formed stars is dominated by the most massive stars, which are also the most short-lived. These stars are much hotter than the Sun and therefore produce much bluer light, peaking in the ultraviolet, but burn through all their energy and explode as supernova in a relatively short time. Powerful ultraviolet light in a galaxy is therefore an indication that it has formed a large number of stars very recently---a starburst! However, star formation in galaxies happens in gas clouds that are also associated with large quantities of dust, some of it produced in the supernova explosions just mentioned. This dust can absorb ultraviolet and visible light, partially or totally obscuring the star formation in those wavelengths of light. The energy absorbed by the dust particles as ultraviolet and visible light is eventually reradiated, but at much longer wavelengths. The light finally emerges from the galaxy as infrared light (also known as "heat radiation"), which is detected by Spitzer. AEGIS observations with Spitzer include "warmer" or shorter wavelength infrared light detected by the Infrared Array Camera (IRAC -- not shown on the image above), and at "cooler" or longer wavelength infrared light detected by the Multiband Imaging Photometer (MIPS, outlined in red in the EGS map). The Spitzer data can reveal star formation which is obscured in the ultraviolet and visible wavelengths by heavy dust absorption. We have mentioned that massive stars are very bright and blue, dominating the light of the galaxy in the ultraviolet and visible ranges. They are however fairly rare---most stars in the galaxy are the size of the Sun or smaller, and are much fainter and redder. These typical stars are much less massive, but there are many, many more of them and they dominate the total mass of the galaxy. Because of this, the brightness of a galaxy in visible light is not necessarily a good indicator of the total amount of mass in the galaxy. Near-infrared wavelengths give a measure of the total mass of stars in the galaxy which is not nearly so biased toward the rare massive ones. The Palomar near-infrared data (not shown on the map above) are used to measure the masses of galaxies. This is an important parameter because it is an intrinsic property of the galaxy that appears to be strongly linked to the galaxy's evolutionary history. The Chandra X-ray data (shown as the solid yellow region) are used to identify active massive black holes. The black holes themselves, although they may be a million times as massive as the Sun, are invisible because light cannot escape the tremendous pull of their gravity. However, when gas in the host galaxy falls in toward the black hole, it forms a very hot disk that radiates X-rays as it spirals in toward the black hole. The AEGIS images of CXO-J141741.9 contain an example of one of these black holes, which shows up very brightly in X-rays while all the other galaxies in the same field are dark. Active black holes at the centers of galaxies (known as "active galactic nuclei") can show up in other types of data as well, including in images taken using radio waves. The grey circles in the EGS map shown the AEGIS radio observations taken with the Very Large Array (VLA) radio telescope. Radio data can reveal active black holes which cannot be seen in X-rays or visible light because they, like some star-forming regions, are obscured by dust. Radio waves pass right through the dust. Radio waves can also trace out faint features that are not detectable at other wavelengths. These include massive jets of material that are being ejected from galaxies by a central black hole. The image of a radio galaxy with jets shows an example of this process. The cyan box in the EGS map outlines the region covered by the DEEP2 Redshift Survey. Redshifts provide distance measurements to many of the galaxies in the EGS. Distances are critical for two reasons. First of all, knowing the distance to a light-emitting object allows you to take the observed brightness of the object and calculate what its intrinsic brightness must be. Second of all, the distance measurements provide a critical third dimension to any map of the sky. Without redshifts, it is impossible to tell whether two galaxies that are right next to each other on the sky are truly near neighbors, or whether one of them is much closer to us than the other so that they look adjascent on the sky but are in reality many hundreds of millions of light years apart. However, the DEEP2 survey can only cover the brighter objects in the EGS. For the fainter galaxies, approximate redshifts can be estimated using the images from the Canada-France-Hawaii Telescope (CFHT) 12k imaging survey (shown here in the black outline) and the CFHT Legacy Survey (not shown). The CFHT data produce so-called "spectral energy distributions" for all of the galaxies in the EGS, which can be used like low-quality spectra. Because astronomers know roughly what the shape of a galaxy spectral energy distribution is for various types of galaxies, they can use them to estimated redshifts for galaxies which are too faint to produce good DEEP2 spectra. The CFHT data also cover a significantly larger area than DEEP2. This discussion has tried to highlight some of the major scientific contributions from each of the AEGIS datasets, but there are many more that cannot be included here. For more information, take a look at the popular science articles and brief descriptions of the scientific articles in the special AEGIS edition of letters to the Astrophysical Journal. |