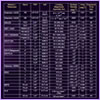
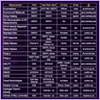
This page contains an overview of the AEGIS collaboration data sets. It includes a brief introduction to the data (taken from the Davis et al. 2007 introduction to the AEGIS ApJ Letters Special Issue), followed by tables summarizing the imaging and spectroscopic data included in the AEGIS survey. Following these is a table that summarizes higher level data products (ie. photometric redshifts, stellar masses, morphologies) derived from the original data by members of the AEGIS team. |
"This study makes use of data from AEGIS, a multiwavelength sky survey conducted with the Chandra, GALEX, Hubble, Keck, CFHT, MMT, Subaru, Palomar, Spitzer, VLA, and other telescopes and supported in part by the NSF, NASA, and the STFC." |
The All-Wavelength Extended Groth Strip International Survey (AEGIS) is a
collaborative effort to obtain both deep imaging covering all major wavebands
from X-ray to radio and optical spectroscopy over a large area of sky
(0.5 - 1 deg2) with the aim of studying the panchromatic properties of
galaxies over the last half of the Hubble time. The region studied, the
Extended Groth Strip (EGS: α=14h17m,
δ=+52°30') is an extension of and owes its name to a
Hubble Space Telescope (HST) survey consisting of 28 Wide-Field
Planetary Camera 2 (WFPC2) pointings carried out in 1994 by the WFPC team
(Rhodes, Refregrier, & Groth 2000). This field benefits from low extinction, low Galactic and
zodiacal infrared emission, and good schedulability by space-based
observatories, and has therefore attracted a wide range of deep observations
at essentially every accessible wavelength over this comparatively wide
field.
Amongst deep multiwavelength fields, the EGS field provides a unique
combination of area and depth at almost every waveband observable. It is two
(HST) to four (for Spitzer and Chandra) times
larger than the combined GOODS fields (Giavalisco et al. 2004), yet has a similar range
of wavelength coverage, making it ideal for studying rare classes of objects
that may be absent in smaller fields. The GEMS field (Rix et al. 2004) covers a
similar area to similar depths, but was studied by the COMBO-17 photometric
redshift survey rather than a spectroscopic survey. Most AEGIS data sets
cover ~0.5 - 1 deg2, considerably smaller than the 2 deg2 COSMOS
field (Koekemoer & Scoville 2005). However, AEGIS observations are deeper at most
wavelengths, benefiting from greater schedulability and lower backgrounds.
Spectroscopy of the COSMOS field is in progress, but will not
be completed for 3 - 5 years. An additional advantage of AEGIS is that deep
HST/ACS imaging is available in two bands (F606W and F814W), whereas
the COSMOS field has been observed in F814W only, while the F850LP imaging in
GEMS is too shallow to study subcomponent colors for most galaxies.
Data from DEEP2 are a linchpin for almost all AEGIS studies, providing
redshifts; internal kinematics for dynamical masses; line strengths for star
formation rates, AGN identification, and gas-phase metallicities; stellar
population ages and metallicites; etc.. The precision and relatively dense
sampling of DEEP2 redshifts allow for accurate measurement of the local
environment of objects in EGS, which is a major factor driving galaxy
evolution. Other surveys at similar redshifts provide weaker environmental
measures due to larger redshift errors, lower sampling rates, and/or smaller
areas (Cooper et al. 2005). Furthermore, we can remove cosmic variance fluctuations
from observed AEGIS abundances by comparing redshift distributions to the
other three, widely-separated DEEP2 fields. Ten instrument teams and a number of theorists are now collaborating on
AEGIS—nearly 100 scientists in half a dozen countries. |